ARC SmaRT Trace
ARC SmaRT (Small Real-Time) Trace is a special debug feature of the ARC cores. The last 8 to 4096 origin and destination jump addresses and other flags can be saved in the SmaRT trace stream. Available flags are: User mode change, task change with RTOS, exception occurred, repetition of control flow, valid jump address.
Synopsys developed the SmaRT feature to have a mighty trace protocol with a smaller footprint and with less power consumption. SmaRT does not deliver ticks or timestamp information. So these virtual ticks are added by UDE® (1 tick per instruction) to enable timing analysis like Execution Sequence Chart or Profiling.
UDE® restores the previous control flow according to the available trace information and enables trace analyses such as Code Coverage, Execution Sequence Chart, Profiling and call graph analysis.
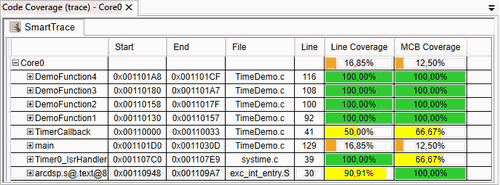
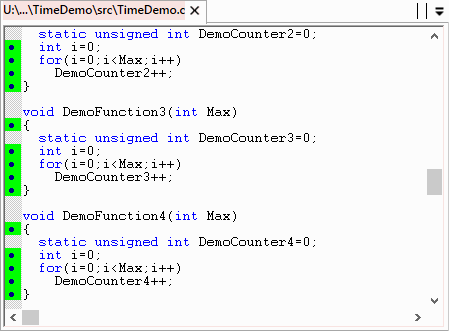
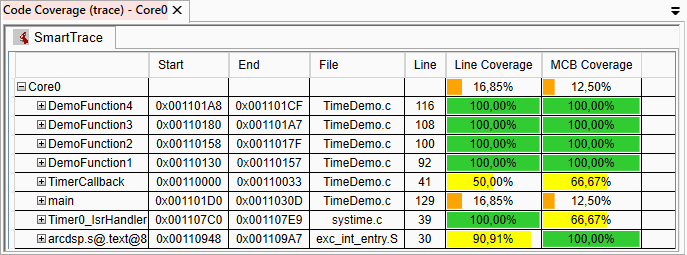
Code Coverage

The Code Coverage chart page for a code range (typically a function) contains a bar chart, which displays the code coverage results of all source lines, which belongs to this range.
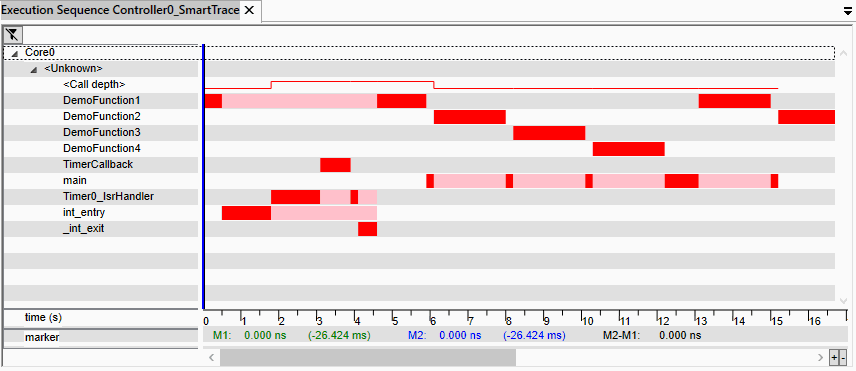
Execution Sequence Chart
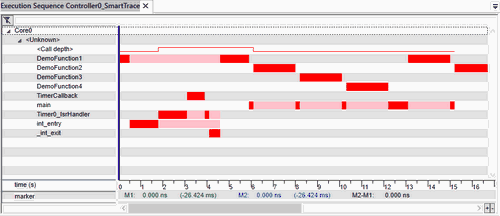
The Execution Sequence diagram can display the interaction of executed code functions over a timeline. Two display modes are possible:
- Instruction pointer mode
- Function trace mode.
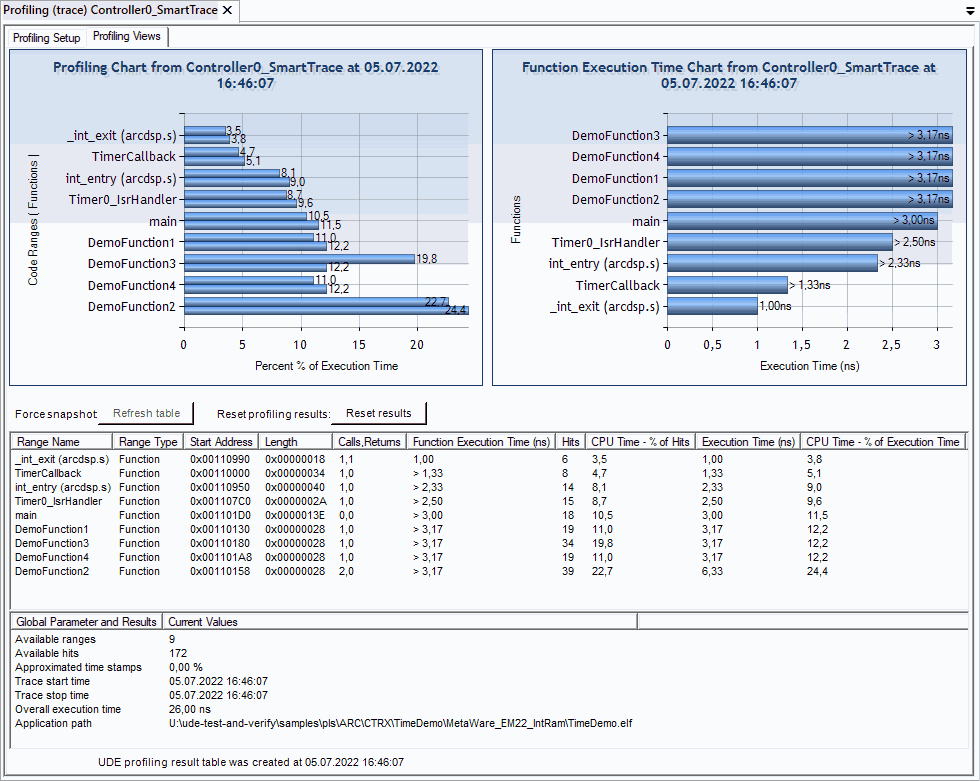
Profiling
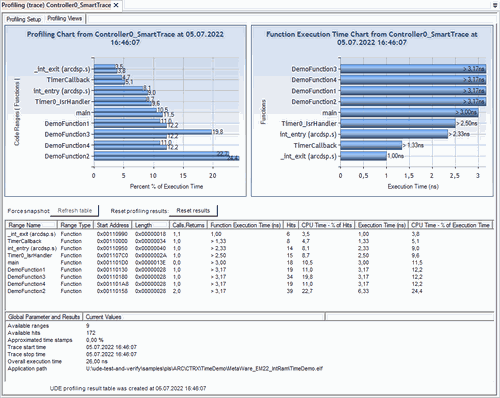
The trace Profiling window displays code profiling information as result of processing code trace data to get from running target program via SmaRT trace channel.
