Multi-core MCA microcontroller debugging Support with UDE® Universal Debug Engine
Control of a multi-core system and debugging is carried out with the UDE® in a consistently designed user interface. Universal Multi-core Workbench is a new add-on of the well-known modular UDE® Universal Debug Engine. With its outstanding features it helps developers of software for multi-core SoC's to make your work more easily, clearly and efficiently.
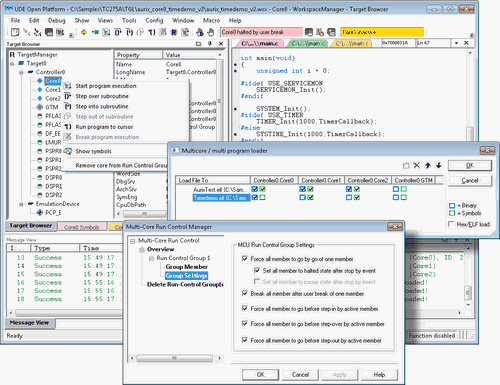
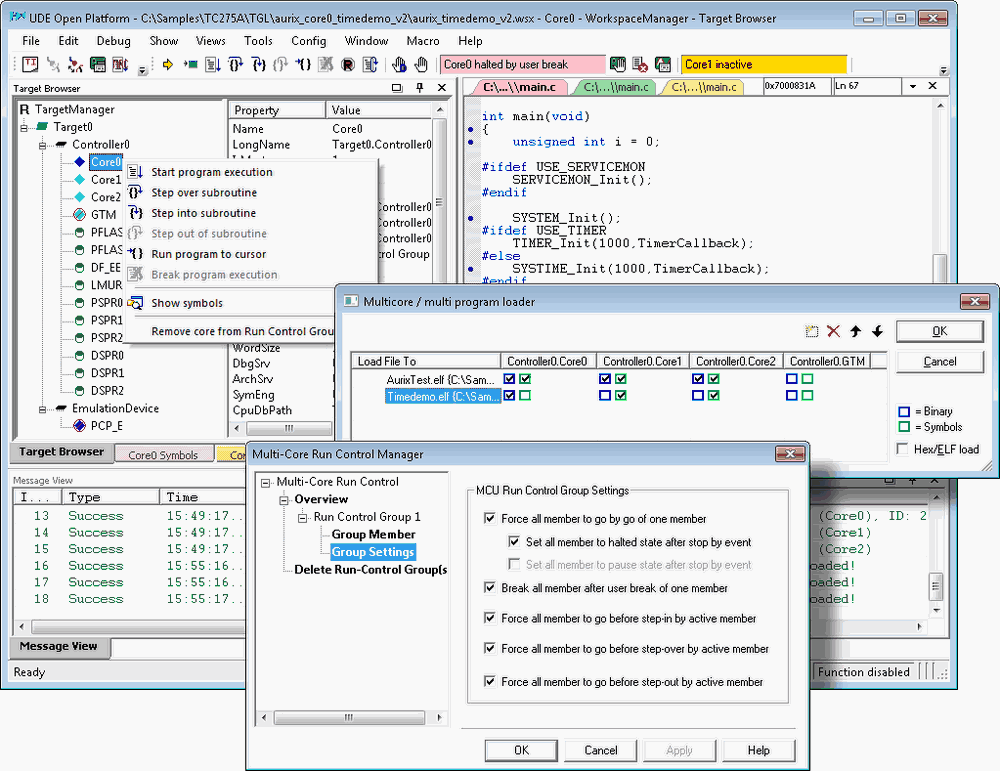
The concept is enhanced by visibility groups for windows of individual cores or freely according to user requirements definable collections of debugger views. Various compiler concepts for multi-core targets are supported by the implemented multi-core / multi-program loader. It enables the separate loading of memory images and symbolic information from the output files of the compiler, specifically for each individual core.
For the control of a multi-core target, the UDE® enables the synchronization of two or more cores to so-called run control groups in order to define common start and stop or common individual step. This also includes the extensive use of existing on-chip trigger and synchronization options of various device manufacturers. The consistent user interface ensures the greatest possible flexibility when controlling a multi-core target, without the need to know the underlying on-chip logic in detail.
- Multi-core debugging target manager to select cores and functional units for debugging Core- or user-specific visibility groups in UDE® Open Platform including core specific coloring
- Multi-core program loader to distribute binary pattern and select core-specific symbol information
- Graphical code coverage analysis allows of structural coverage to fulfill ISO26262 requirements
- Profiling functions based on instruction pointer trace data from On-chip Emulators (MCDS and SPU) including AURORA trace, Nexus, ETM, ETB, TMC, instruction pointer snooping or simulator output
- The Universal Emulation Configurator (UEC) describes measuring tasks for on-chip emulators
- Parallel test of software for multiple cores independently of their architecture within one user interface
- Synchronization of multiple cores for the debugging (common start and stop) and parallel visualization of context information after synchronized program execution
- Graphical visualization of variables from programs of different cores as time-based two-dimensional diagram in a common view
- The central management for download and distribution of software from one or more ELF files to multiple cores
- Multi-core trace with common analysis and visualization of executed program and data accesses in one or more views of the development user interface.
- Debugging of multiple CPU’s in the same framework
- Common and core specific views enables sophisticated debugging of programs, which program execution is distributed into different cores
Multi-core run-control enables synchronisation of program execution of multiples core (common stop by break of one core, common start of all core of the dedicated run-control group) - Flexible distribution of loaded programs into different cores – Multi-program load feature allows to assign loaded program to specific cores and enables to manage architecture specific structures of memory devices like common program flash and core specific local memories
- Multi-core target manager enhances management of separate cores during debugging of distributed programs
- Multi-core aware framework increases navigation speed into large amount of core -specific and global views (containing visualization result from different cores)
- Core specific colouring of framework elements
- Views can be assigned to visibility groups, which can be switched on or off due to a specific debug context
- Multi-core program trace allows to trace program execution of different cores and visualize time relationships of core specific program flow in common views
- Multi-core program trace is supported by industry leading PLS Universal Emulation Configurator concept.
For the control of a multi-core target, the UDE® enables the synchronization of two or more cores to so-called run control groups in order to define common start and stop or common individual step. This also includes the extensive use of existing on-chip trigger and synchronization options of various device manufacturers. The consistent user interface ensures the greatest possible flexibility when controlling a multi-core target, without the need to know the underlying on-chip logic in detail.
For simple processing of the large amounts of data, which occur when tracing several sources, the UDE® is equipped with a multi-core trace framework that on the one hand allows conventional troubleshooting on the basis of the recorded data and on the other hand offers various statistical analyses such as profiling analysis and code coverage.
With help of the target manager cores and functional units can be specifically selected for debugging. In order to also be able to retain an overview with several cores, debugger window tabs and toolbars are core-specifically colored.
The concept is enhanced by visibility groups for windows of individual cores or freely according to user requirements definable collections of debugger views. Various compiler concepts for multi-core targets are supported by the implemented multi-core / multiprogram loader. It enables the separate loading of memory images and symbolic information from the output files of the compiler, specifically for each individual core.
Universal Access Device 3+ (UAD3+) sets new standards in multi-core/multi-target debugging and in high end real-time trace. The UAD3+ is based on a modular concept and offers high -speed debug access to AURIX, TriCore, PowerArchitecture, Cortex-A and further MCU architectures. Multiple JTAG extender pods can be connected via a long cable to ensure a flexible adaptation with the target connector. The UAD3+ is designed for best on class performance.
- High-speed JTAG debug access with up to 160 MHz shift clock
- Multi Target / Multi System Access - up to 8 JTAG interfaces supported in parallel
- Standard I/O ring voltage 1.6 - 5.5 Volts, extended I/O ring voltage 0.8 - 3.3 Volts on request
- Supported debug connectors
- JTAG / DAP / DAP2 (Infineon) connector
- Nexus Debug Port (OnCE) connector
- Optional galvanic isolation
- Separate JTAG extender pods are connected to the UAD3+ by Gigabit serial cables up to 5 meters long ( 0.5m, 1m - default, 2m and 5m )
- Wide range of host interfaces, USB2.0 HS, Gigabit-Ethernet (10/100/1000Mbps).
High Speed Serial Trace support up to 4 Lanes @ 3.125 Gbit/s
The Universal Access Device 3+ allows the recording of real-time trace information via a high speed serial trace based interface.
- Maximum of 4 lanes supported, maximum data rate per lane is 3.125 Gbit/s
- Trace memory scalable up to 4 GBytes
- Time-endless trace for a continuous tracing and observation
- Separated high speed serial trace pod is connected to the UAD3+ by a Gigabit serial multi -lane cable up to 5 meters long ( 0.5m, 1m - default, 2m and 5m )
- Support of AURORA based Trace protocols (Samtec ERF8 HS22, Samtec ERF8 HS34, Samtec ERF8 HS40, additional customer specific trace connectors).
In summary the Universal Multi-core Workbench is a new development tool which strongly optimizes the debugging and test of software for multiccore SoC's.
In practice the new Universal Multi-core Workbench is used for the first time for the new multi-core microcontrollers for automotive applications which were published at the end of last year from Infineon and Joint Development Program from NXP and STMicroelectronics.
These new multi-core devices are milestones for the real-time efficiency of automotive applications. They contain three processor cores which are connected in such a way by a crossbar that they are running with full speed and without any access conflict. Further the implementation contains some FLASH modules and an easy to use and powerful micro programmable Timer Module (up to 8 micro cores) which relieves the main CPU's by nearly independent generation of engine control signals. These devices demand new concepts and debugging functions for development of engine control unit (ECU) software.
The new functions for test of multi-core software running on up to 5 cores (three main cores, micro programmable Timer Module and Security Core) in hard real time will used for the first time for power train (engine and transmission control) by the market leaders for ECU's.
