Universal Debug Engine UDE and Microcontroller Debugger for AURIX, TriCore, Power Architecture, Cortex, Arm, RH850, RISC-V, SH-2A, STM32, Stellar, S32, S32V234, S32V, S32K, XE166/XC2000, XScale
With Universal Debug Engine (UDE®) PLS offers on top solutions for software development of systems-on-silicon including debug support for the 16-/32- and 64-bit microcontrollers XC166, XC2000, XE166, XMC4500, STM32, C166S V2, SDA6000, TriCore™ and AURIX™ TC25, TC27, TC29, TC33, TC35, TC36, TC37, TC38, TC39 from Infineon and STMicroelectronics, Power Architecture® MPC56, MPC57, MPC58, S32, S32V234 from NXP™, S32R from NXP™, PowerPC™ PPC440SPe from AMCC, Cortex®-R52 Stellar from STMicroelectronics, Power Architecture® SPC56, SPC57, SPC58 from STMicroelectronics, Arm7™, Arm9™, Arm11™, Cortex, Cortex-M0, Cortex-M0+, Cortex-M3, Cortex-M33, Cortex-M4, Cortex-M7, Cortex-R4, Cortex-R52, Cortex-A8, Cortex-A9, RH850, RISC-V, SuperH™ SH-2A, STM32, S32V, S32K, XScale™ derivatives in a new multi-core debug environment as well as technical support.
Latest Enhancements of UDE
The extensive feature list includes functions like: high speed and flexible target access via JTAG, cJTAG with OCDS L1, EmbeddedICE, OnCE, COP, DAP, DAP2, SWD support, OCDS L2 trace, MCDS trace, miniMCDS trace, CoreSight™ trace, ETM trace, ETB trace, Nexus trace, ASC, SSC, 3Pin and CAN, in-system FLASH memory programming of FLASH / OTP with UDE Memtool, support of various RTOS, OSEK® and test automation tools. UDE latest version offers new features:
Complete Eclipse based TriCore Development Platform
- Complete Eclipse based TriCore / TriCore AURIX TC4, TC39, TC37, TC29, TC27 MCA (Multi-core Architecture) Development Platform and emulation kits with DAP/DAP2 support
- DXCPL support
- AURIX TC4, TC3 FLASH Programming: Support for 'Software Over The Air' (SOTA) mode
- Hardware Security Modul (HSM), Generic Timer Modul (GTM), CIF video stream trace supported.
Complete Eclipse based Power Architecture Development Platform
- Complete Eclipse based Development Platform
- Improved Power Architecture® MPC5746M (incl. Emulation Device), MPC5744K, MPC5777M, MPC5744P, S32R, SPC57EM80, SPC58EG84 support
- Hardware Security Modul (HSM), Generic Timer Modul (GTM)
- Universal Emulation Configurator (UEC) and Nexus Trace support Sequence Processing Unit (SPU)
- Time Processor Unit Multi-eTPU, Dualcore and LockStep supported
- Support JTAG over MCAN debugging added
- VLE technology support, Nexus trace support.
Enhanced Arm7, Arm9, Arm11, Cortex, Cortex-M0, Cortex-M0+, Cortex-M3, Cortex-M4, Cortex-M7, Cortex-R4, Cortex-R52, Cortex-A8, Cortex-A9, Cortex-A53, RH850, RISC-V support
- Multi-core Debug via one JTAG chain support, and CoreSight GigaByte Trace
- Cortex-A9, Cortex-A53, Cortex-M0, Cortex-M3, Cortex-M4, Cortex-R4, Cortex-R52 Xilinx Zynq-700, LPC1850, LPC4300, XMC1000, XMC4000, K60 Kinetis, FM3, TMS570, STM32, S32V, S32K, S32V234, Stellar support
- RH850 support
- SPIFI Programming support
- Arm / Cortex Thumb/Thumb2 mode code supported.
Further features and enhancements
- AURORA Gigabit Trace (AGBT) with UAD3+ for AURIX, MPC57, MPC58, S32R and SPC57, SPC58 Emulation Devices
- SERIAL Gigabit Trace (SGBT) with UAD3+ for AURIX TC4x
- AURORA Trace for Cortex-R52 Stellar Automotive Devices
- XCP Support for Cortex-R52 Stellar Automotive Devices
- Universal Trace Framework (UTF) with persistent trace streams for offline analysis of captured and saved trace data
- Unique search function supports the rapid analysis of very large amounts of trace data, bookmarks of trace points introduced
- Call Graph analysis for efficient investigation of runtime behavior
- Displaying of ECU variables for measurement and calibration purposes based on A2L files according to ASAM MCD-2 MC description standard
- Improved trace features as persistent storage of trace sessions for analysis, comprehensive filters
- Core- or user-specific visibility groups
- Test automation with Python scripts and other scripting laguages
- Execution Sequence Chart for visualization the program flow and its sequence in time
- Function Sequence Chart improved
- Graphical code coverage analysis allows branch coverage to fulfil ISO26262 requirements
- Automatic generation of Code Coverage reports for further analysis
- Profiling functions based on code trace data from On-chip Emulators (MCDS, miniMCDS and SPU) including Aurora, Nexus, ETM, ETB, ITM, PTM, FTM trace and also IP snooping or simulator output
- Accumulation of Profiling and Coverage data over multiple trace measurement tasks
- Data trace for GTM Multi-channel sequencers
- GTM trace support for miniMCDS
- PikeTec‘s Time Partition Testing (TPT) systematic test case design supported
- Tool Qualification Packages (TQPs) for the TESSY test platform for various architectures and cross compilers coupled with the full range of UDE features
- Extended multi-core-run control manager, extended multicore/ multi-program loader
- RTOS-Awareness for RTX (CMSIS)
- Improved Graphical window with Hardware Trace (MCDS, miniMCDS, NEXUS, and ETM) Signal Chart, Graphical display of IP and function traces
- Supported OS: Windows® 10 (64-bit), Windows® 11 (64-bit).
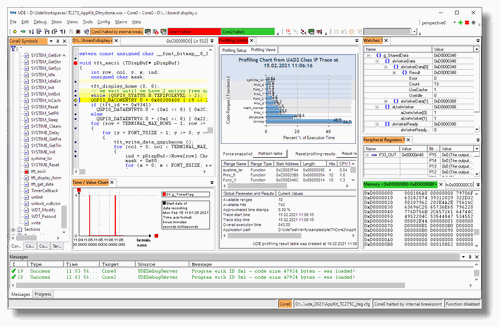
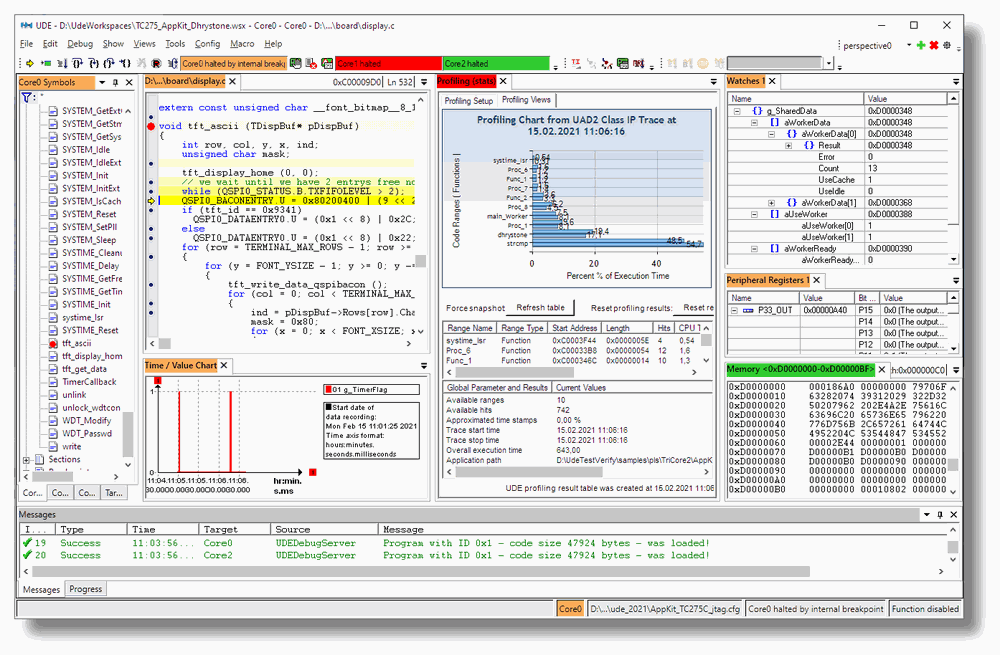
Control of a multi-core system and debugging is carried out with the UDE in a consistently designed user interface. Universal Multicore Workbench is a new add-on of the well-known modular "Universal Debug Engine". With its outstanding features it helps developers of software for multicore SoC's to make your work more easily, clearly and efficiently.
The knowledge of CPU load distribution of the running target application is a basic requirement to optimize their real-time behaviour. UDE supports the profiling of code trace data from different sources:
- Profiling via Nexus code trace / ETM code trace
- Profiling via MCDS, miniMCDS code trace
- Profiling via ARM SoC-Designer PCP2 simulator trace
The trace data of the instruction pointer will be collected according to their occurrence in functions of the application. If the address value cannot be assigned to any known function, it will be assigned to known code sections of the program (depending on debug information). The evaluation counts the hits of appropriate ranges and calculates the execution time of the ranges via the execution time of the trace samples.
The results are available as Profiling chart diagram and as numeric result table. The Profiling results can be saved in a free selectable XML base data sink for later processing using the UDE Profiling page. This data sink can be processed in a normal MS Excel 2003 environment or can be processed by Windows Script languages and MS XML parser function (which are installed by UDE). All functions to access to the generated profiling data are also available via the UDE object model to allow creation of internal and external scripts for automatic post-processing. Python and other scripting languages are supported.
UDE supports Code Coverage. Software quality assurance in electronic control devices, according to the ISO 26262 standard, is often a fairly difficult task in practice. Especially in real-time-critical multicore systems, typical control-flow-oriented methods, which use instrumentation code additionally built into the code for coverage measurement, very quickly reach their limitations. A new non-invasive method now allows for the first time determining the statement (C0 Code Coverage) and branch coverage (C1 Code Coverage) even with optimized code. The measurement is based on code trace data, which were delivered by MCDS, miniMCDS, NEXUS, ETM, TMC and CoreSight hardware trace channels.
- DAP, the 2- or 3-wire debug interface for TriCore AUDO Future and other upcoming devices is supported
- JTAG OCDS L1, Nexus, OnCE, SWD, COP and EmbeddedICE are fully supported by UDE offering direct high-speed access to the MCU's internal units and features like breakpoints, stepping in ROM/FLASH as well as complex trigger conditions without any external hardware or software resources
- MCDS trace, miniMCDS trace, OCDS L2 trace, ETM / ITM® trace, TMC trace, ETB trace and Nexus trace support allows the watching of the flow of a running program in realtime within the process environment for core, PCP, PCP2, DMA, if available
- Target monitor and bootstrap loader solutions for a flexible access via a wide variety of debug channels (ASC, SSC, 3Pin, CAN) are available
Universal Debug Engine integrates High-Speed FLASH / OTP Memory Programming Support - UDE Memtool for internal FLASH/OTP, external FLASH EPROMs (NOR-FLASHs AM29F xxx, i28F xxx family, Serial EEPROMS via I2C and SPI, NAND-FLASHs) and any other JEDEC-compatible FLASH Memories.
Being an integrated part of UDE, the open interface for User Definable Enhancements enables you to easily create completely new types of applications:
- HTML Scripts based on standard UDE ActiveX Control and customer-specific controls together with PERL and JAVA scripts provide fully customized hardware visualization and control
- The Automation Interfaces of the UDE components even allow using basic UDE services for controlling the debugger and processing target communication, program flow control and symbol processing by external Python, C/C++, VisualBasic and VBA applications
- Substitution of the standard UDE desktop client by a customized desktop to fit the requirements of service tools, Matlab or another third-party tool integration by using the COM interface
HTML Scripts based on standard UDE ActiveX Control and customer-specific controls together with PERL and JAVA scripts provide fully customized hardware visualization and control. The Automation Interfaces of the UDE components even allow using basic UDE services for controlling the debugger and processing target communication, program flow control and symbol processing by external Python, C/C++, VisualBasic and VBA applications.
Development Platform for Power Architecture
The Development Platform consists of the following basic elements:
- a GNU-based C/C++ compiler toolchain from HighTec with professional maintenance and services
- the integrated development environment Eclipse, and
- the Universal Debug Engine.
The Power Architecture Development Platform is a well integrated joint product of HighTec and PLS Development Tools. The platform can be extended by the PXROS-HR real-time operating system with integrated MPU management.
Main Features
The compiler and the debugger of the Power Architecture Development Platform UAD2 support the embedded PowerArchitecture® families MPC56, MPC57, MPC58, S32R from NXP, SPC56, SPC57, SPC58, SPC56EL from STMicroelectronics.
Eclipse IDE
- Project management
- Setup wizards
- Version control
The Eclipse-based 'Power Architecture Development Platform' allows the simple definition of projects. After having selected a particular microcontroller derivative, the generation of a project with a correct startup code, the necessary hardware initialization, a valid memory layout, and the corresponding header file for the names and bit fields of the peripheral register can be prompted virtually at the push of a button. The project contains a simple main function, which allows the implementation to be started immediately.
GNU C/C++ compiler
- VLE support
- SPE support
- Using optimised addressing modes
- Additional floating point software emulation
- Professional long-term maintenance and services
UDE Support
For debugging and testing the applications, the Development Platform includes a direct connection to the PLS Universal Debug Engine (UDE). The UDE can be started with all necessary settings directly from the IDE, thus hugely simplifying program function tests on the target hardware. Of course, the UDE also allows testing of PXROS-HR applications with memory protection.
- Target access via JTAG
- Supports Nexus and on-chip trace
- FLASH programming
- Real time data monitoring and graphical view
- Execution Time measurement
- Instruction Pointer Profiling
- Simulated I/O
PXROS-HR with Memory Protection
The PXROS-HR realtime operating system with integrated MPU management is an optional component of the Development Platform. Modern micro-controllers, such as Arm Cortex-M3, TriCore and Power Architecture, include a Memory Protection Unit, which guarantees safe integration of functionalities consisting of different software components. With these features PXROS-HR is ideally suited for safety-critical applications and rugged industrial solutions.
Furthermore, a library, especially developed for the PXROS debug monitor PXmon, allows the Universal Debug Engine to use the JTAG debug channel as fast communication vehicle for the exchange of data with running PXROS-HR applications. System conditions, such as the stack consumption of individual tasks, the process sequence of tasks, the processor workload due to individual application parts as well as the workload of resources are graphically displayed. The user is thus provided with an effective tool for testing PXROS-HR based programs and optimising the performance parameters of the application.
Development Platform for AURIX/TriCore
The Development Platform consists of the following basic elements:
- a GNU-based C/C++ compiler toolchain from HighTec with professional maintenance and services
- the integrated development environment Eclipse, and
- the Universal Debug Engine.
The TriCore Development Platform is a well integrated joint product of HighTec and PLS Development Tools. The platform can be extended by the PXROS-HR real-time operating system with integrated MPU management.
The Universal Debug Engine can also used smoothly together with the VX toolset for AURIX/TriCore from Tasking and with the TriCore Optimizing C/C++ Compilers from Greenhills.
Main Features
The Platform includes an Eclipse-based integrated Development Environment with powerful wizards, and supports all TriCore derivatives. It manages the project settings and the entire build process for compiler, assembler and linker. PLS have integrated their UDE debugger into the standard Eclipse environment. Launching the debugger within Eclipse will open the new UDE perspective with high-end debugging features.
Eclipse IDE
- Project management
- Setup wizards
- Version control
- DAvE importer
- Model-driven memory layout definition
The Eclipse-based 'TriCore Development Platform' allows the simple definition of projects. After having selected a particular microcontroller derivative, the generation of a project with a correct startup code, the necessary hardware initialization, a valid memory layout, and the corresponding header file for the names and bit fields of the peripheral register can be prompted virtually at the push of a button. The project contains a simple main function, which allows the implementation to be started immediately.
HighTec GNU C/C++ compiler
- Additional C compiler for Peripheral Control Processor (PCP)
and MCS/GTM timer module of AURIX TC3xx. - Built-in _bit type
- Use of optimal addressing modes: absolute, register relative, circular
- Saturating integer arithmetic and packed data operations
- FPU support
- Additional floating point software emulation
- Professional long-term maintenance and services
Tasking C/C++ VX toolset
- Additional C compiler for Hardware Security Module (HSM), Peripheral Control Processor (PCP),
XC800 Standby controller (SCR) and MCS/GTM timer module of AURIX TC3xx. - Infineon Technologies TriCore EABI compliant
- Language extensions for Embedded/DSP/TriCore
- VX technology for optimization of code size/ speed.
UDE Support
For debugging and testing the applications, the Development Platform includes a direct connection to the PLS Universal Debug Engine (UDE). The UDE can be started with all necessary settings directly from the IDE, thus hugely simplifying program function tests on the target hardware. Of course, the UDE also allows testing of PXROS-HR applications with memory protection.
- Target access via JTAG
- Supports OCDS LII and on-chip trace
- FLASH programming
- Real time Data Monitoring and Graphical View
- Execution Time measurement
- Instruction Pointer Profiling
- Simulated I/O
PXROS-HR with Memory Protection
The PXROS-HR realtime operating system with integrated MPU management is an optional component of the Development Platform. Modern micro-controllers, such as ARM-Cortex-M3, TriCore and Power Architecture, include a Memory Protection Unit, which guarantees safe integration of functionalities consisting of different software components. With these features PXROS-HR is ideally suited for safety-critical applications and rugged industrial solutions.
Furthermore, a library, especially developed for the PXROS debug monitor PXmon, allows the Universal Debug Engine to use the JTAG debug channel as fast communication vehicle for the exchange of data with running PXROS-HR applications. System conditions, such as the stack consumption of individual tasks, the process sequence of tasks, the processor workload due to individual application parts as well as the workload of resources are graphically displayed. The user is thus provided with an effective tool for testing PXROS-HR based programs and optimising the performance parameters of the application.
Newest TriCore™ derivatives AURIX™ TC4, TC39, TC38, TC37, TC35, TC33, TC27, TC23, TC22, TC29xED, TC1798, furthermore the XC2000, XE166, XMC4500 from Infineon, the Cortex-M0, Cortex-M0+, Cortex-M3, Cortex-M4, Cortex-M7, Cortex-A8, Cortex-A9, Cortex-R4, Cortex-R52, i.MX25, i.MX31, STM32 derivatives, various Power Architecture / PowerPC derivatives as MPC57, MPC58, S32R, SPC57, SPC58, STM32, Stellar, S32, S32V234, S32K, RH850, RISC-V and SuperH SH-2A are supported !
UDE Manual
The UDE Manual with the UDE debugger description is available as PDF UDE Manual.
Ordering code
| <Selected uC-Architecture> | / | <Selected Access Device> |
