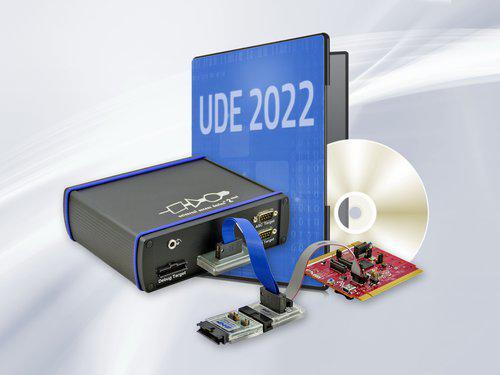
UDE® 2022 with new highly efficient features for system analysis and debugging of automotive applications
April 20, 2022
UDE® 2022, the new major version of the Universal Debug Engine® offers completely new system features such as support for the AUTOSAR Run-Time Interface (ARTI) and several other optimized tool details.
The newly added features of UDE® 2022 are designed to make the development of automotive applications in particular even more efficient and to achieve even higher software quality. For example, ARTI support will enable in-depth analysis of the runtime behavior of AUTOSAR-based systems.
ARTI defines a comprehensive, standardized interface between the build tools as well as the debug and trace tools and, in addition to detailed debug information, also provides a model for detailed runtime measurement and analysis of operating system tasks and their runnables. This includes not only simple timing measurements, but also the possible states of tasks, runnables and interrupt service routines.
The UDE® 2022 uses the ARTI file (arxml) generated during the build process to display all relevant debug information in an appropriate way. For comprehensive, trace-based runtime analysis and time measurements, PLS also offers developers the ArtiHookGenerator, a standard-compliant tool that can be used to implement so-called hooks in the AUTOSAR application or in the respective operating system. With the help of these hooks, the UDE® 2022 can record event traces, analyze them and visualize them in the Execution Sequence Chart. The recorded trace data can either be exported as ASAM MDF (Measurement Data Format) or as BTF (Best Trace Format) and then subsequently processed by timing tools.
The runtime analysis and visualization functions have also been further optimized for applications outside the AUTOSAR environment. For example, the Execution Sequence Chart now contains detailed information about the current states of the visualized functions. This makes it easier to see whether a function is being executed, has just been interrupted, i.e. is on the stack, or is not running at the time in question. For the display of the stack depth, the visualization is changed from a bar chart to a graph, which is a much clearer representation.
In addition, users of the UDE® 2022 benefit from several enhanced operating functions. For example, it is now possible to navigate easily to the next or previous execution of a selected function either using the cursor keys or via the menu. This option is particularly helpful in practice when the user is interested in executions of a particular function that are far apart in time. A new auto time zoom function allows to display the entire recorded time range in the chart quickly. Data export has also been enhanced for incorporation with third-party tools. Various export formats such as BTF or ASAM MDF allow further use of the recorded trace data in timing tools from various vendors.
The core register window of UDE® has been completely revised. Depending on user preference, it is now possible to switch between the classic view and a hierarchical layout. As before, depending on the architecture, banked registers can be displayed. However, a compact tabular view is now also available, which can be optionally switched to. It provides a complete view of all banked registers at a glance.
C++ support has also been further optimized in UDE® 2022. For example, symbol names such as classes, methods and members are now displayed in the symbol browsers, taking template definitions and namespaces into account.
The extensive debug functions of UDE® 2022 are available for a large number of new high-end microcontrollers from different manufacturers. For example, with the TDA4VM, DRA829 and DRA821 devices, the Arm Cortex-A72-based Jacinto family from Texas Instruments is supported for the first time. In addition, support for Renesas Electronics' RH850 device family has been extended with the inclusion of the RH850/U2A. The latest controllers of the S32 Automotive Platform from NXP Semiconductors and Infineon's AURIX multi-core MCUs also benefit from the unique feature set of UDE® 2022. For multi-core debugging of the new AURIX TC4x family, for example, UDE® 2022 enables software testing and debugging not only on real hardware, but also on virtual prototypes from the Synopsys Virtualizer Development Kit or on UDE’s instruction set simulator TSIM. Also new is the support for Synopsys' ARC EV cores, which are used, among other things, for the Parallel Processing Unit (PPU) in the AURIX TC4x. For the development with Infineon's AURIX TC3xx controllers, UDE® 2022 now also enables debugging of the XC800-based SCR standby controller. For this, the tool optionally uses either the separate DAP interface of the SCR as debug channel or the DAP interface of the TC3xx. The SCR and the main cores of the AURIX microcontroller can be run within a common UDE® debugger instance.
The analysis functions have also been expanded considerably, especially for the latest generation of the Arm CoreSight trace unit ETMv4 implemented, for example, in the multi-core SoCs of the Stellar SR6 P and SR6 G families from STMicroelectronics. Among other things, an additional process step that can be activated optionally now allows correlates the recorded data accesses to the corresponding load/store instructions.
UDE® 2022 will be available by the end of April.

